When Oil Reaches the Shore – The True Cost of a Baltic Sea Oil Spill
URN:
Abstract
The true cost of an oil spill cannot be predicted from the number of tonnes of oil released into the sea alone. An offshore spill, a spill in a port and oil reaching shores of archipelago will create different response tasks and losses. This article develops oil spill analysis from my 2023 master’s thesis at Satakunta University of Applied Sciences (SAMK). It explains the figures through tables and case examples and separates actual incidents from hypothetical calculations. The distinction matters for vessel traffic services (VTS), response planning and marine insurance.
Introduction
In my SAMK thesis, Hakala, T. (2023). Vessel Traffic Service efficiency analysis from financial perspectives: Case study for Fintraffic VTS. I assessed the economic value and efficiency of VTS partly by examining the possible costs of different maritime accidents. Oil spills were a particularly important example of these. (Hakala, 2023). The basic argument was straightforward. Preventing one serious accident may avoid costs far beyond damage only to the ship. The word cost covers several different angles. A response authority pays for equipment and personnel. A fishing business may lose most of its income. An insurer or compensation fund may later pay for a valid claim. A researcher may estimate the value of loss in recreation and the industry around it. These amounts should be identified separately before they are compared in the big picture.
A useful way to start is with the conditions of the spill. Oil type, distance from the shore, weather, shoreline, and the number of people and businesses using the affected area can all change the result. Etkin (2000) analyzed more than 300 spills in 40 countries and found that a single price per ton cannot represent these differences in an accident.
Why location and oil type matter
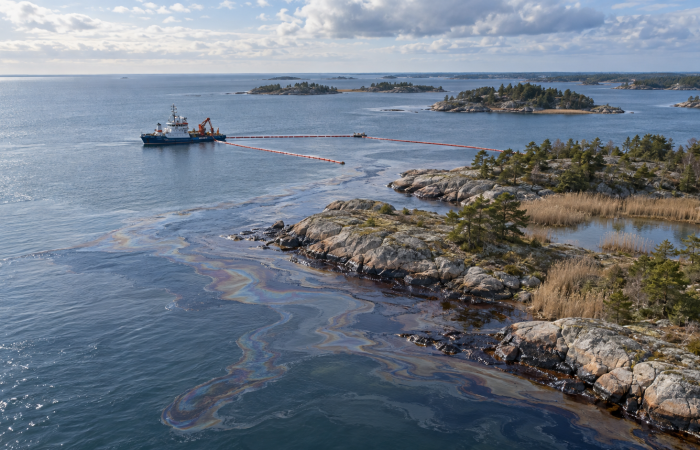
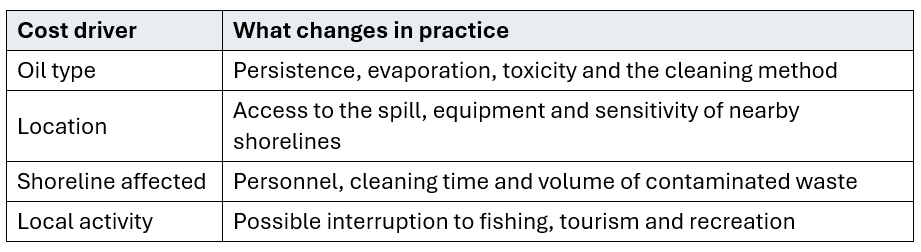
Oil remaining at sea may be difficult to contain, particularly in challenging weather. If it reaches fast land, responders must also clean rocks, beaches or harbor structures and handle the results of oily waste. Heavy oils tend to be persistent and can be particularly demanding to remove. Lighter products raise different concerns, including toxicity and, in some settings, provide also fire risk (Etkin, 2000; ITOPF, International Tanker Owners Pollution Federation, 2003).
Table 1 Main factors behind oil spill costs adapted from Etkin 2000 and Hakala 2023
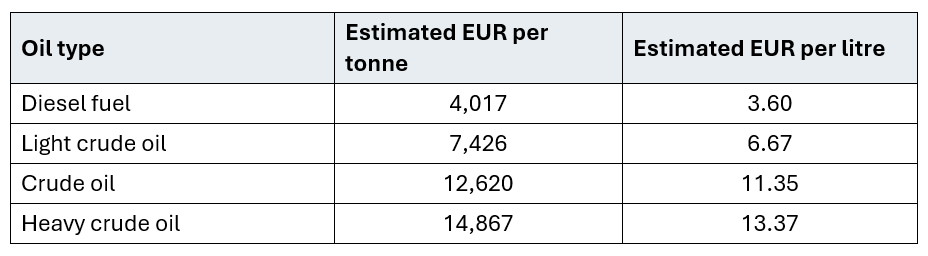
The figures in my thesis illustrate the size of these differences. Its conversion of Etkin’s historical international observations to 2023 euros produced the following estimates by oil type. They are historical comparison values, not current prices or a reliable quotation for a future cleanup cost (Etkin, 2000; Hakala, 2023).
Table 2 Historical cleanup cost per oil tonne comparisons converted (Hakala 2023)
The thesis also reported on location-based values of cleaning costs in different locations
- EUR 34,248 per tonne in-port,
- EUR 39,068 per tonne nearshore
- EUR 14,436 per tonne offshore.
The nearshore category in that table means within five kilometers of land (Hakala, 2023). These are alternative ways of grouping earlier cases. One should not add the oil-type rate to the location rate or apply either rate automatically to the entire cargo of a ship.
A second illustration uses a shoreline labor estimate attributed to Forsman (2006). In the thesis, 75 person-days for each kilometer, multiplied by 500 kilometers of contaminated shoreline and EUR 195 per person-day, gives EUR 7.31 million. Average man days/ km * affected kilometres * EUR/man day = X EUR.
75 * 500*195 = 7 312 500 (Hakala, 2023).
This is an example of labor-based shore cleaning costs. It is not the cost of the full spill bill. Equipment, at-sea work, waste treatment and economic losses are outside that simple multiplication. This example would be the overall cost of the cleaning only. This above figure, for example, would be straight comparable to an oil disaster within the Swedish coastline with approximately 22-25 000 tons of crude oil involved.
What actual accidents tell us
The oil tanker Erika broke in two near the coast of France in 1999. The distinction between the actual oil cargo and spilled oil is important here. My thesis described 31,000 tonnes as spilled, but ITOPF reports that Erika carried approximately 31,000 tonnes and that about 19,800 tonnes of it entered the sea. Oil reached and polluted about 400 kilometers of the coastline. Responders collected 190,000 to 200,000 tonnes of oily waste, much of its material were of soil mixed with oil rather than oil alone (ITOPF; Hakala, 2023). This case shows how a smaller mass of oil can generate a much larger quantity of waste to handle, which in comparison raises the amount of collected waste.
The vessel Princess Empress sank in the Philippines in 2023. My thesis used early information about the cargo and affected coast to produce two very different hypothetical cleanup figures (Hakala, 2023). Those figures were planned examples, not final expenditures. The IOPC Funds (International Oil Pollution Compensation), later set out processes for claims concerning fisheries, property and tourism, together with the shipowner’s liability arrangements for the incident (IOPC Funds). The range of claims explains why an early estimate based solely on the oil quantity will usually miss part of the whole economic story.
The thesis also refers to the grounding of the container vessel Rena, combining salvage, cargo recovery, oil response and wreck removal in one reported amount (Hakala, 2023). It gives no separate source for the EUR 590 million figure. I therefore do not treat that number as a verified cleanup cost. Even when an overall casualty total is well documented, its different components must be separated before it is used to estimate the cost of pollution in whole.
Three Baltic Sea scenarios
A study prepared for Baltic Master II examined hypothetical spills affecting Blekinge, Skåne and the Polish coast. The table below reproduces the rounded figures used in my thesis. All amounts are millions of euros in the original 2012 scenarios. They are neither recorded accident costs nor forecasts at today’s prices (Tegeback and Hasselström, 2012, as reproduced in Hakala, 2023).
Table 3 Hypothetical Baltic spill costs by Tegeback and Hasselström 2012 as reproduced in Hakala 2023
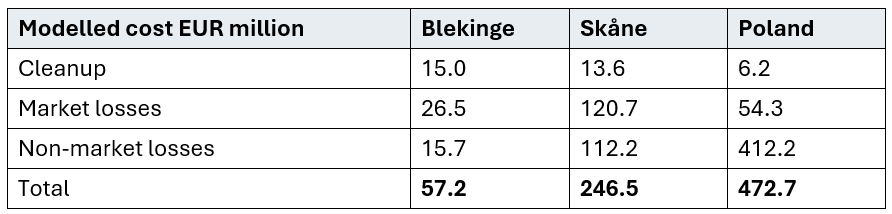
Market losses in the study include effects on tourism and commercial fishing. Non-market losses reflect, for example, changes in recreational fishing and the value people place on using a beach. Poland has the lowest modelled cleanup bill but the highest overall total, mainly because the assumed loss of beach recreation is larger. A reader looking only at cleanup expenditure would miss that result, which usually stays hidden. The figures also depend heavily on the scenario assumptions and valuation method.
There is also a legal qualification. An economic model can assign value to lost recreation, but that does not mean the same amount will be paid as compensation. Applicable rules determine which losses are recoverable, and claimants must provide solid evidence. The IOPC Funds’ guidance for Princess Empress, for instance, describes the need to show an actual, quantifiable economic loss for relevant claims (IOPC Funds).
In my thesis I suggested that Blekinge’s archipelago is a more useful geographical comparison for parts of the Finnish coast than a long sandy beach. That does not make its euro figures straight transferable to Finland. The length and accessibility of the shoreline, season, weather, oil trajectory, response resources and local livelihoods would need to be assessed for a particular Finnish coast scenario (Hakala, 2023).
What this means for VTS and insurance
Vessel Traffic Service may identify a developing navigational danger and give proactive information or a warning. Whether that intervention would prevent a particular grounding or collision depends on the circumstances and the bridge team’s actions onboard. It cannot be assumed from the size of a possible oil spill. A credible estimate of VTS benefit needs evidence of traffic conditions, the warning opportunity, likely vessel response and the accident pathway. The consequence estimates and the probability that VTS will change the outcome are separate questions.
Insurance analysis also begins by separating losses. Damage to the ship, salvage, cleanup, losses suffered by others and environmental restoration may fall under different covers and legal rules. The same casualty can therefore produce several bills and several kinds of claims. Historical averages help identify exposure, but incident records, invoices and evidence linking each loss to the oil spill are needed before payment can be assessed and figured.
Future research
The most useful next step would be a Baltic case study linking a defined navigational hazard to a plausible VTS intervention and then to an oil spill scenario. It should map the likely trajectory and affected coast, estimate response and economic consequences separately, and test which claimed losses could be supported by evidence. Such a design would make the economic case for prevention more robust than multiplying a generic cost per tonne by a hypothetical spill volume. An actual oil spill creates so-called ripple effects to the economy way longer inshore than just to the sea frontier on the shores.
Conclusion
An oil spill’s consequences depend on where oil ends and what it affects, not only on how much of it escapes from the cargo and bunker holds. The historical tables, actual casualties and Baltic scenarios each answer a different question. Read together, they show why response spending, wider economic loss and compensation must be kept distinct from each other. My SAMK thesis provides the starting material for this comparison, while checking its figures also requires correcting MT Erika’s spilled quantity and treating its converted euro amounts as illustrations. For VTS, preparedness and insurers, an estimate is most useful when the assumptions and the category of loss are clear. The efficiency and economic value of VTS operations can be drawn up to quantitative levels from these.
Timo Hakala
Researcher, Maritime Logistics Research Center
Senior Advisor, Master Mariner and doctoral researcher in marine.